
Suite | Professional, Enterprise, or Enterprise Plus
Support with | Explore Professional or Enterprise
Explore features a prebuilt dashboard to help you monitor how well omnichannel routing queues are distributing work to agents. Supervisors can use this dashboard to understand the inbound and outbound volume of queues, average and longest wait times for any given queue, and drill down to tickets within the queue to understand why the ticket entered or exited the queue.
This article contains the following topics:
Current limitations
- Call tickets are not captured by the omnichannel routing queues dataaset. This is planned for a future release.
Opening the dashboard
Use the following procedure to access the queues dashboard.
To access the dashboard
- In Explore, click the Dashboard icon (
)
- From the list of dashboards, click the Queues dashboard.
Understanding the reports
The queues dashboard contains the following tabs:
Activity tab
The Activity tab shows information about the tickets that have entered and exited any given queue. In this report, you can also drill into queues to see which exact tickets have entered or exited the queue, with specific inbound or outbound reasons. You can filter the reports by Date, Channel, Queue and Queue Groups.
Activity tab headline metrics
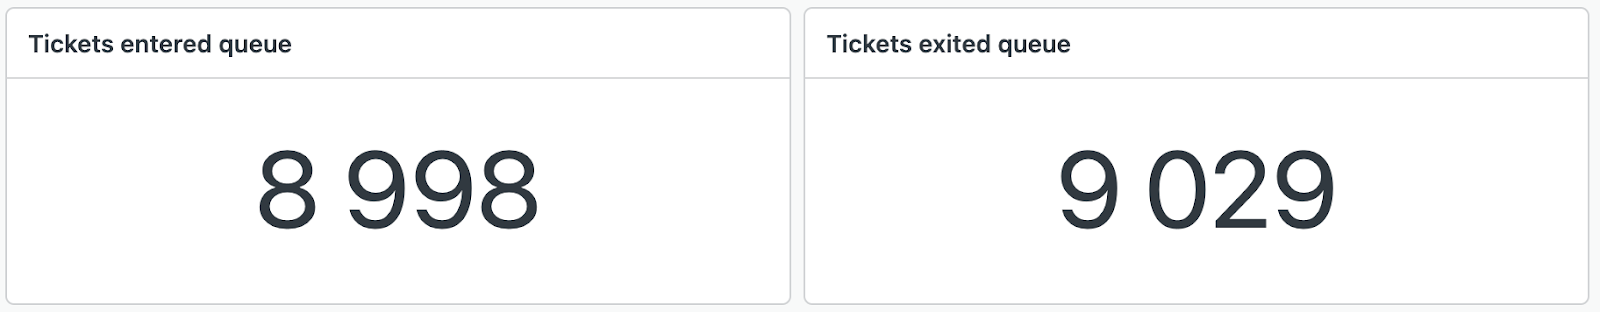
This tab displays the following headline metrics (KPIs):
- Tickets entered queue: The total number of tickets that entered queues within the specified filter conditions.
- Tickets exited queue: The total number of tickets that exited queues within the specified filter conditions.
Activity tab reports
This tab displays the following reports:
- Tickets Entered vs. Exited: The total number of tickets that entered and exited queues daily within the specified filter conditions.

- Volume details: A table that shows, for each queue and each day, how many tickets have entered and exited the queue for each channel.
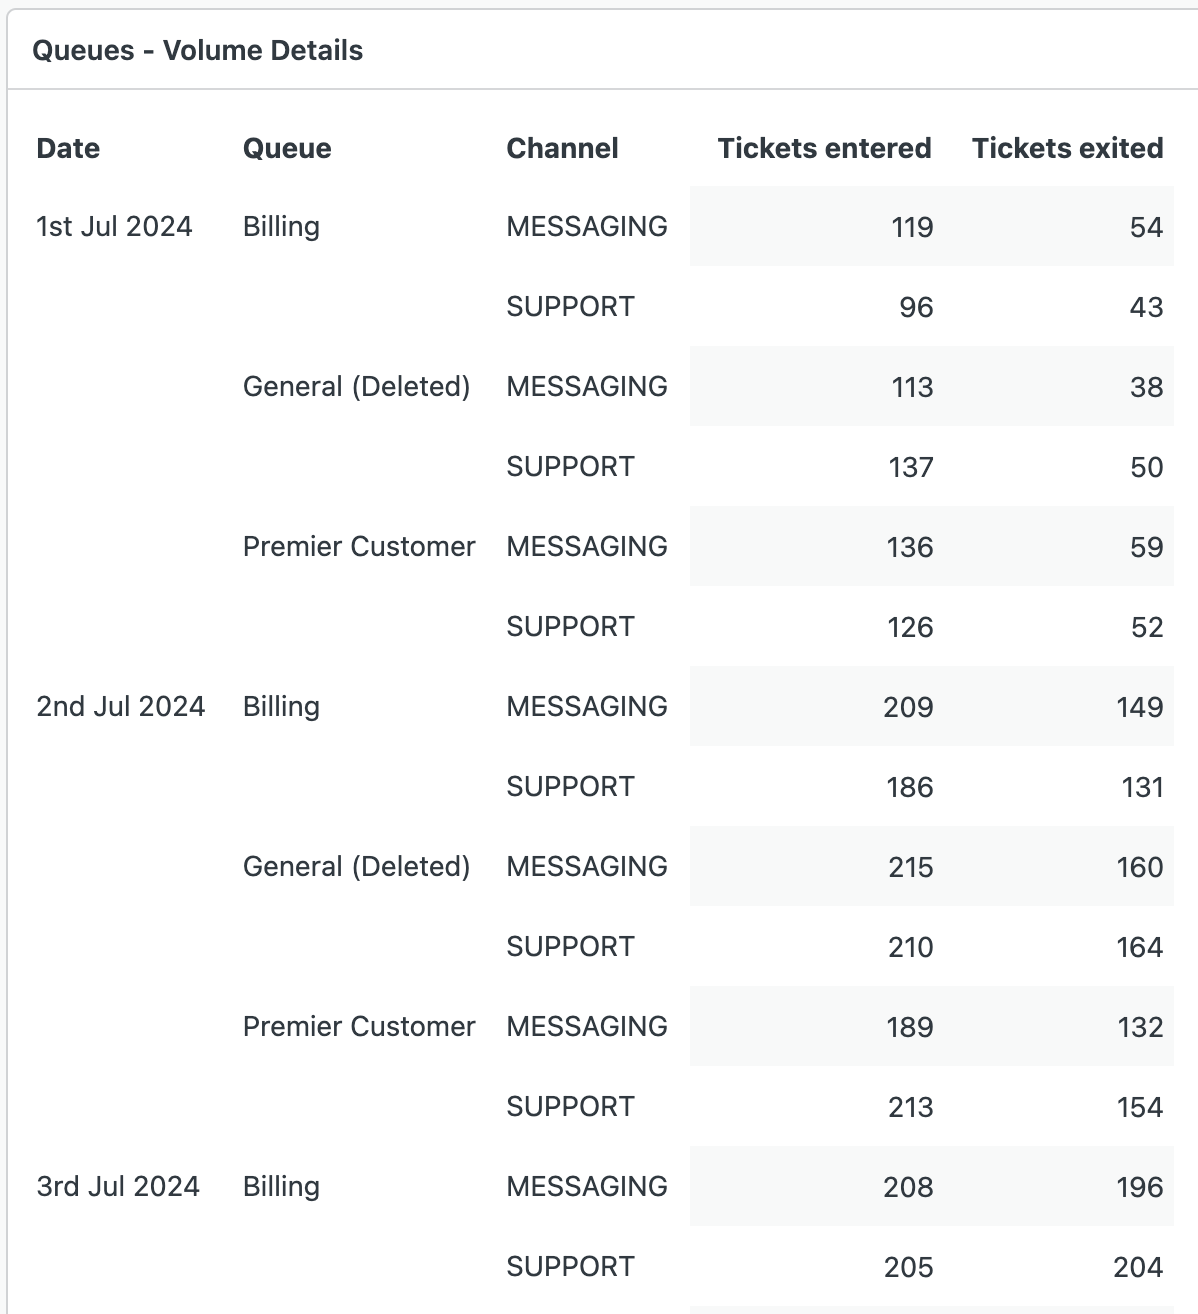
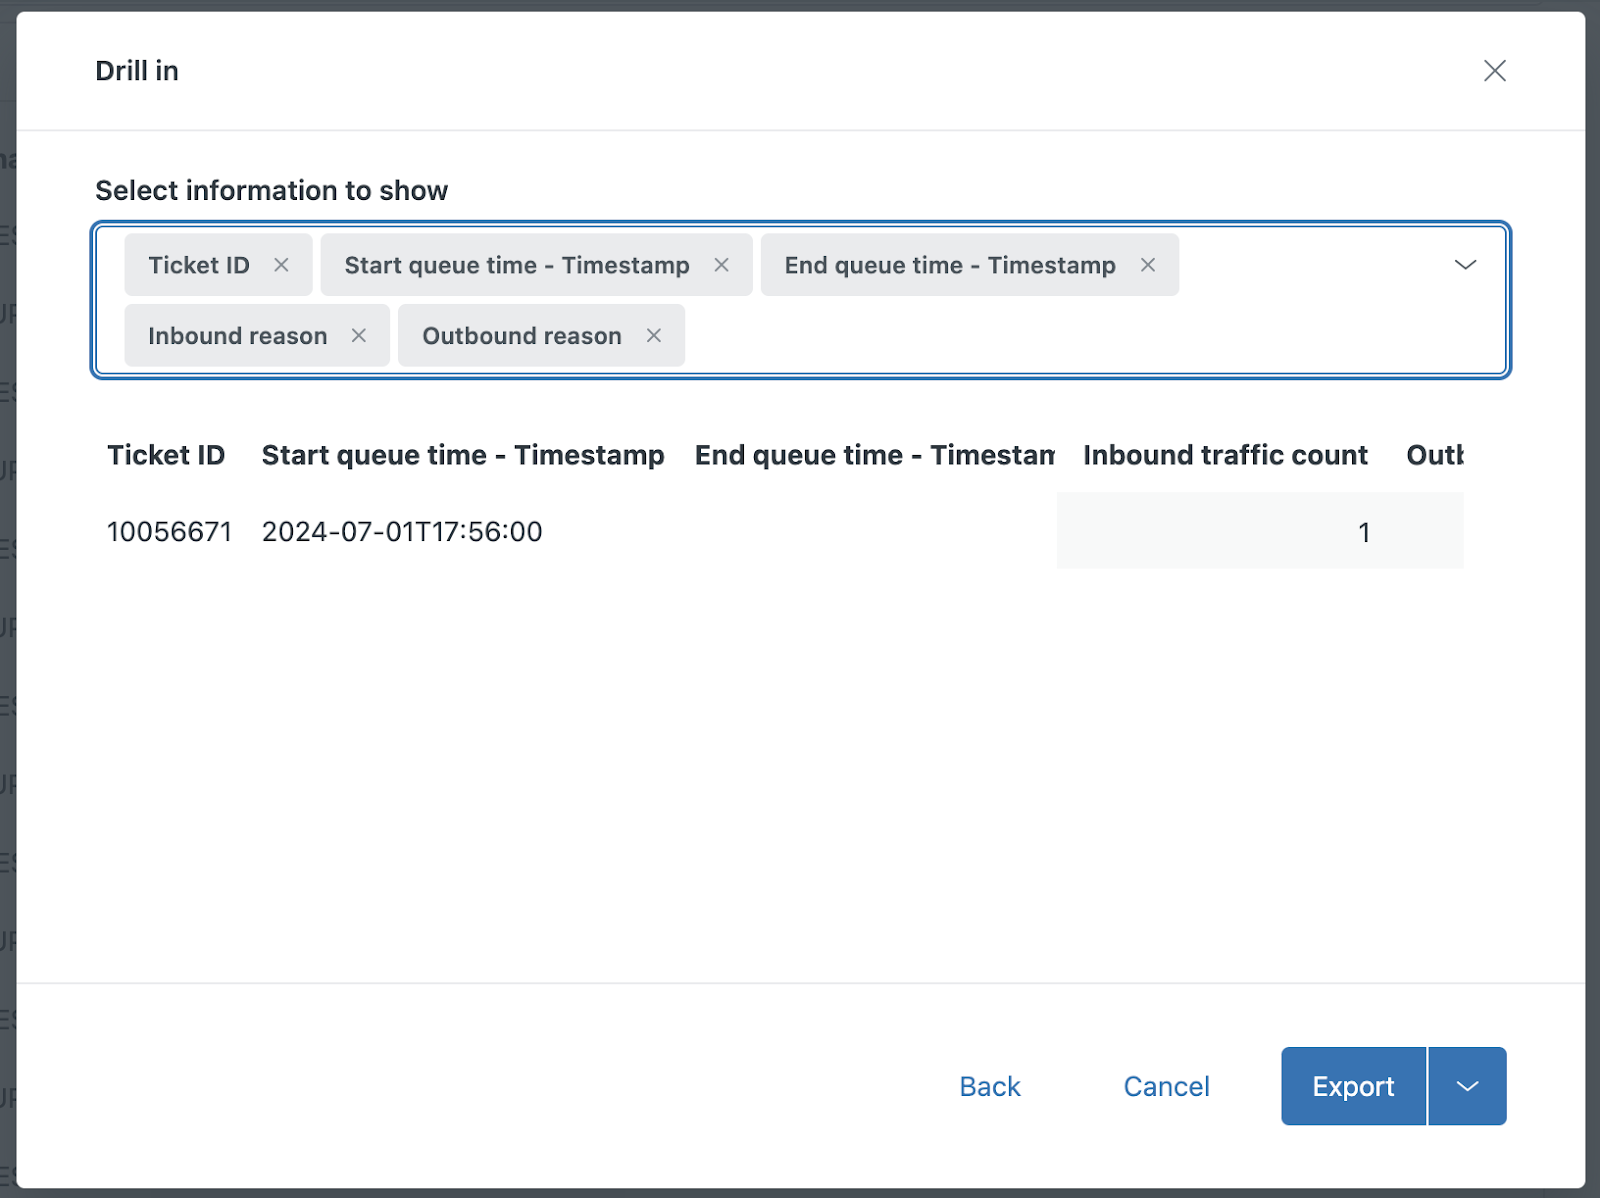
You can drill into this report to see more details such as ticket IDs that have been counted towards the calculated metric and inbound or outbound reasons to describe why the ticket had entered or exited the queue.
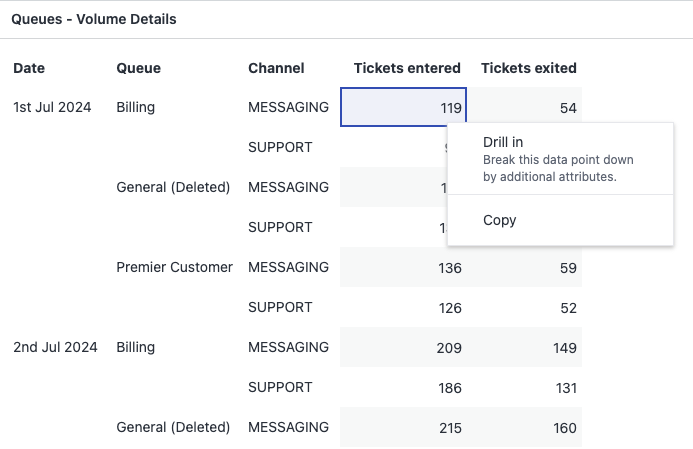
Drill in to view tickets: View the ticket, and whether it had entered or exited the queue within the corresponding day of the chosen data point. You can drill in further to view more details around when and why the ticket entered or exited the queue at that time.
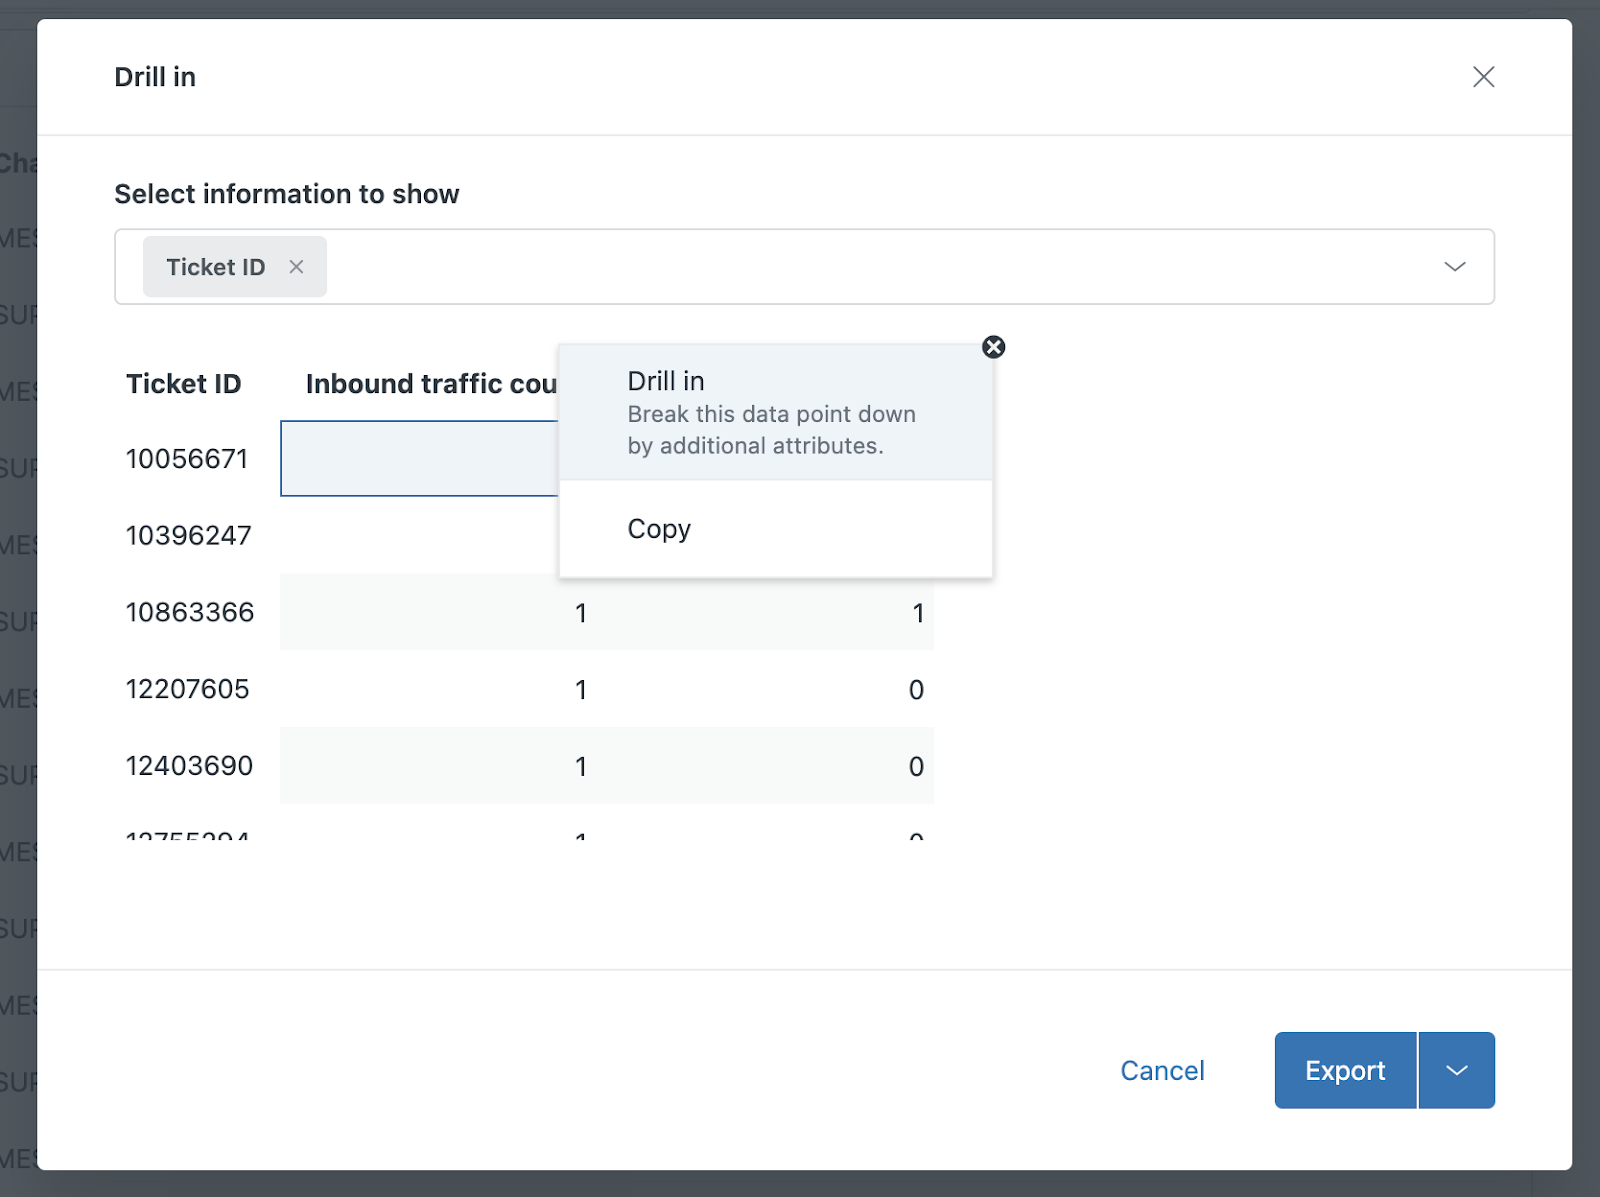
Drill in to view ticket inbound or outbound details: View when and why the selected ticket entered or exited the queue at that time.
Wait times tab
The Wait times tab shows information about how long tickets have waited in the queue. You can filter the reports by date, channel, queue and queue groups.
Wait times tab reports
This tab displays the following reports:
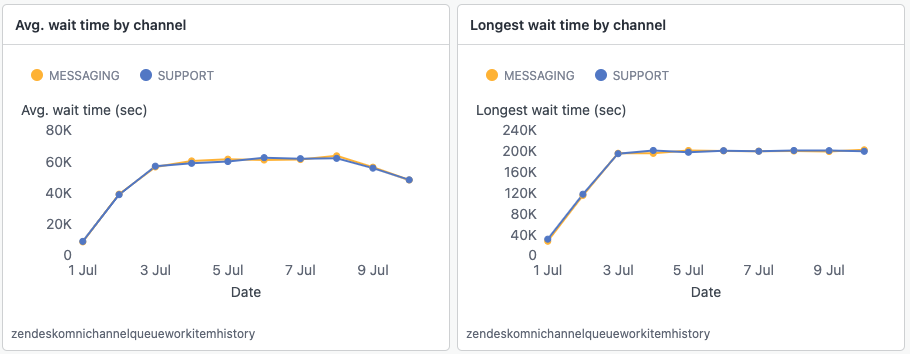
- Average wait time by channel: The average wait time by channel daily within the specified filter conditions.
- Longest wait time by channel: The longest wait time by channel daily within the specified filter conditions.
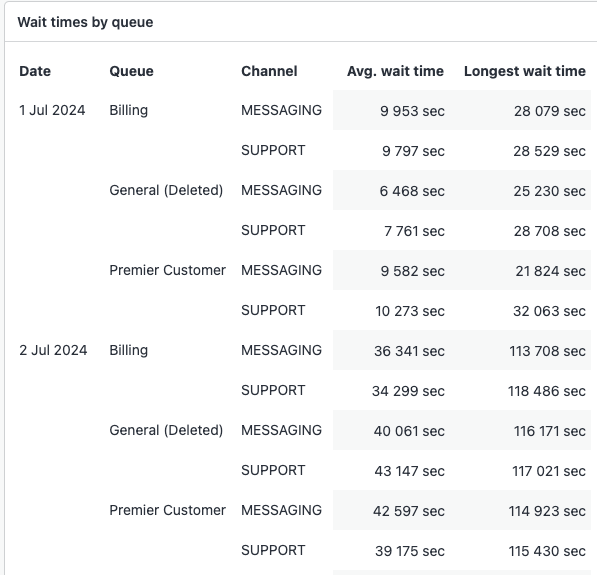
- Wait times by queue: A table of the average and longest time a ticket spent in the queue for each channel, per queue and day.
0 comments
Please sign in to leave a comment.