
Zendesk analytics features a prebuilt dashboard to help you monitor your agent productivity across channels. This includes key indicators around your agent's responsiveness, efficiency, and availability. Supervisors can use this information to understand how well agents are managing their workload and how agents are spending their time throughout the day.
This article contains the following topics:
Opening the Agent productivity dashboard
The agent productivity dashboard is available in the dashboards library.
To open the agent productivity dashboard
- Click the Dashboard icon (
 ) in the left sidebar.
 - From the list of dashboards, select one of the following:
- (If you don't use omnichannel routing) Zendesk omnichannel: Agent productivity
- (If you use omnichannel routing) Zendesk omnichannel: Agent productivity with unified and custom state and activity
The two dashboards are similar in layout, but the dashboard for omnichannel routing customers includes information about unified and custom states in addition to channel-specific states. Any differences between the dashboards are called out in the report descriptions below.
Considerations when using the dashboard
Consider the following before you begin using the dashboard:
- When you filter the dashboard, make sure to filter by both group and agent. If you filter only by agent, data is duplicated if the selected agent is in multiple groups.
- When you export the dashboard, duration data in the export is always calculated in seconds.
Understanding the reports
The dashboard contains the following tabs:
Summary tab
The Summary tab contains reports that give you an overall look at your agent's performance and what state groups or agents were in over a specified period of time. You can filter the reports on the dashboard by Date, Channel, Group, Agent name, and Agent state. If you use omnichannel routing, the Channel filter is not displayed and the reports are automatically filtered by the Unified channel value.
Summary tab headline metrics
This tab displays the following headline metrics (KPIs):
-
Performance metrics overview: An overview of agent
performance across all channels. These metrics are derived from agent engagements. This table
includes:
- Assignment to first response time: Average time taken for an agent to respond to a ticket from when they were assigned it.
- Average response time: Average time taken by an agent to respond to their tickets.
- Average handle time: Average time an agent spends handling tickets.
- First reply time: Average amount of time an agent spends to provide the initial response on tickets from when the ticket was first offered to the agent.
- CSAT: Average CSAT for tickets that an agent was assigned.
- One-touch tickets: Number of tickets solved by an agent with one reply.
- Online time: The total amount of time that the filtered groups or agents were in the Online state.
- Offline time: The total amount of time that the filtered groups or agents were in the Offline state.
- Away time: The total amount of time that the filtered groups or agents were in the Away state.
- Transfers only time: The total amount of time that the filtered groups or agents were in the Transfers only state.
- Invisible time: The total amount of time that the filtered groups or agents were in the Invisible state.
Summary tab reports
This tab displays the following reports:
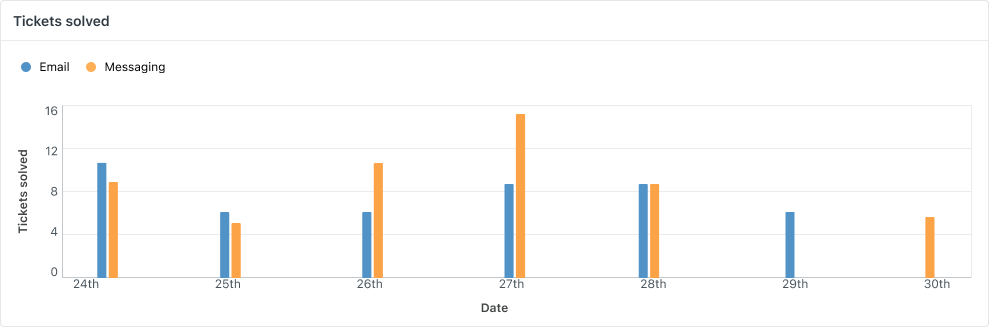
-
Resolution per hour: The total number of tickets solved by
the selected groups or agents on an hourly basis throughout the selected
time period.
-
Time in state by day (online and offline): The total number
of hours spent in the Offline and Online states by the selected groups or
agents.
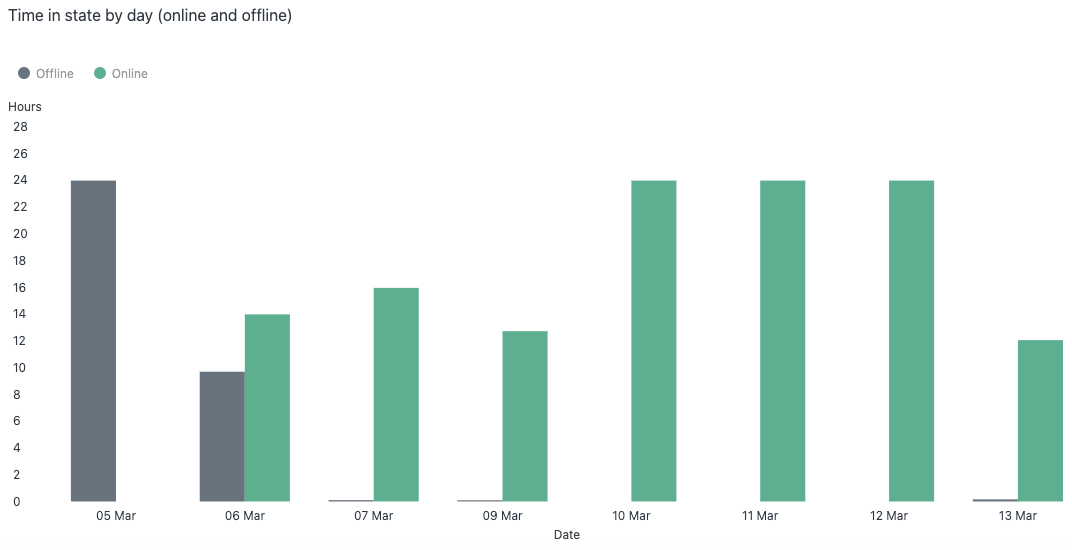
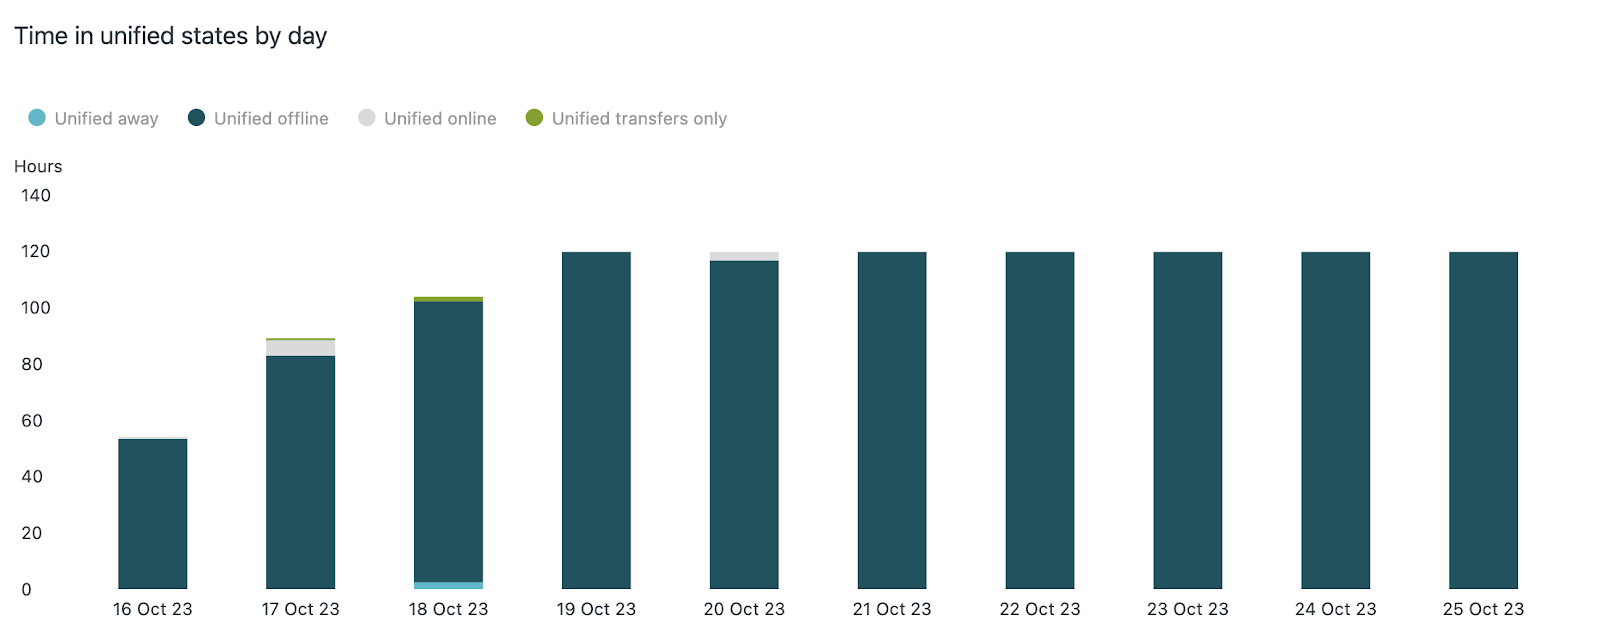
If you use omnichannel routing, this report is called Time in unified states by day and shows the total number of hours spent in the Away, Offline, Online, and Transfers only states by the selected groups or agents.
-
Time in custom states by day (top used): (Appears only if you use
omnichannel routing.) The total number of hours spent in the top five custom
states by the selected groups or agents.
Performance ranking tab
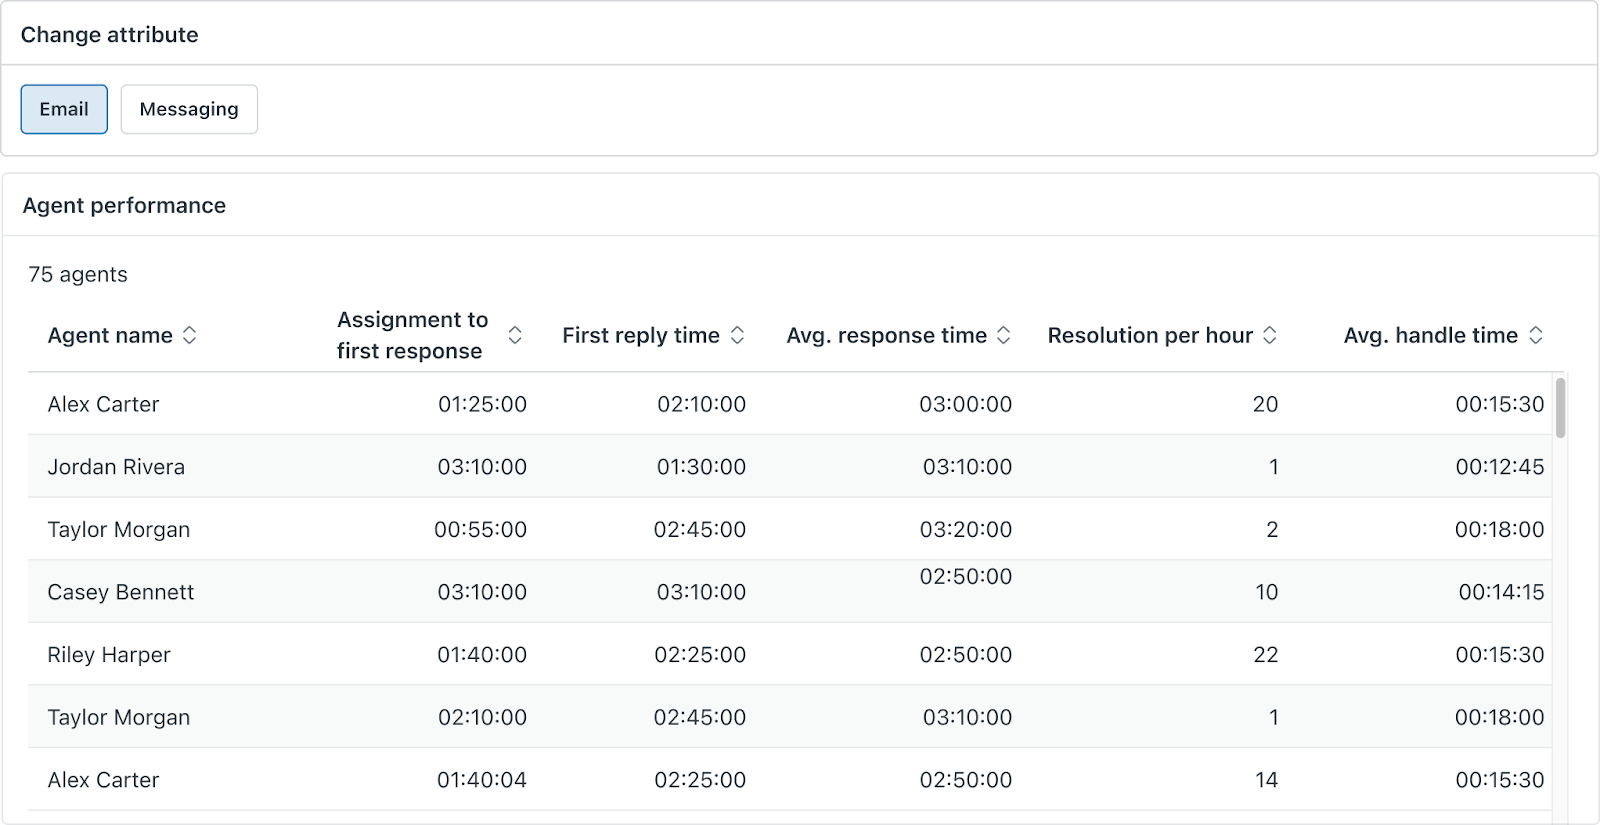
The Performance ranking tab gives a quick overview of team performance for a given time period. You can filter the reports on the dashboard by Date and Group.
By default, email performance is shown sorted by your agent's shortest average handle time. You can click any of the channel attributes in the table heading to filter by other channels, and click any of the other column headings to sort by your select key performance metrics.
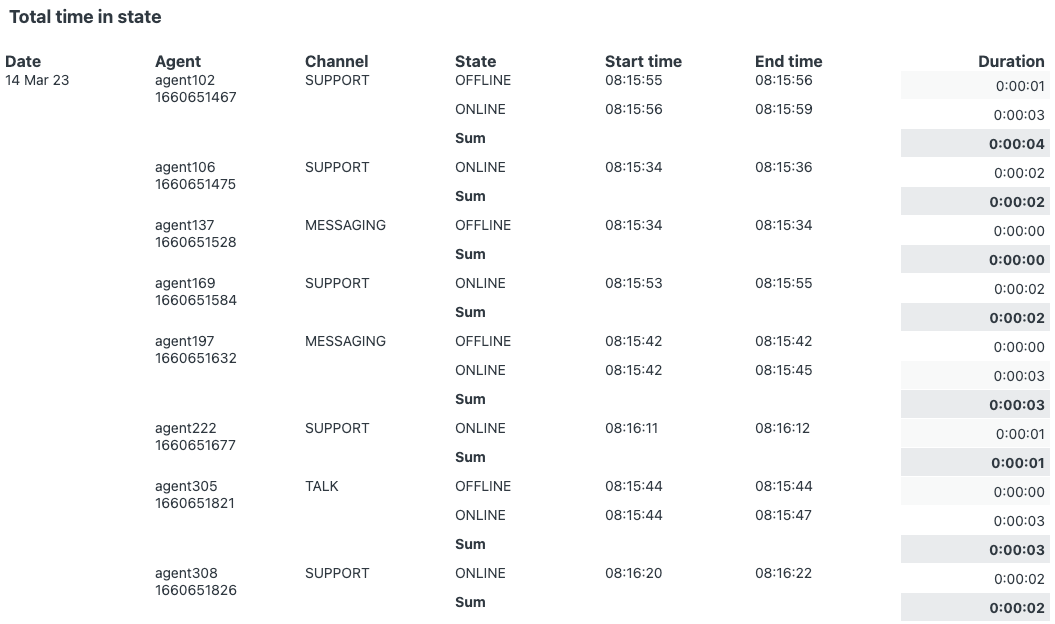
State detail tab
The State detail tab contains a single report that lets you dig further into how agents spent their time. You can filter the reports by Date, Channel, Group, Agent name, and Agent state.
By default, the report is filtered to include only the Online, Away, Transfer only, Invisible, and Offline states (if you don’t use omnichannel routing), or unified online, unified away, unified transfers only, and unified offline states (if you use omnichannel routing).
If you see gaps in your agent's state information, you can update the Agent state filter to include the Disconnected and Unknown states, as well as custom states (if you use omnichannel routing). The Disconnected value means that the agent’s connection to the system was interrupted, which can happen when the agent’s computer is disconnected from the internet, the internet browser puts the agent’s tab to sleep, or other circumstances. The Unknown value means that the report was unable to return a value for the agent’s state.
Additionally, if you use omnichannel routing, the report is filtered to include only the Unified channel by default, but you can update the filter to include other channels as needed.
If you apply a multi-day time filter to this report, the filter applies to both the start time and the end time of an agent state. This means that the Duration column might show more than 24 hours in a given state for a single day. See Why does the State detail dashboard show a duration of more than 24 hours for a single day?
If you use omnichannel routing, you can filter this report by both a specific channel (for example, Messaging) as well as the Unified channel. If you do, it’s important to note that the duration of time spent in a per-channel status equals the duration of time spent in a unified status plus any custom statuses that are mapped to that per-channel state. See Why is the per-channel agent status time different than the unified agent status time?
Tip: To discover the per-channel status each custom status is mapped to, see Viewing unified agent statuses.
Assigned work tab
The tab displays the following reports:
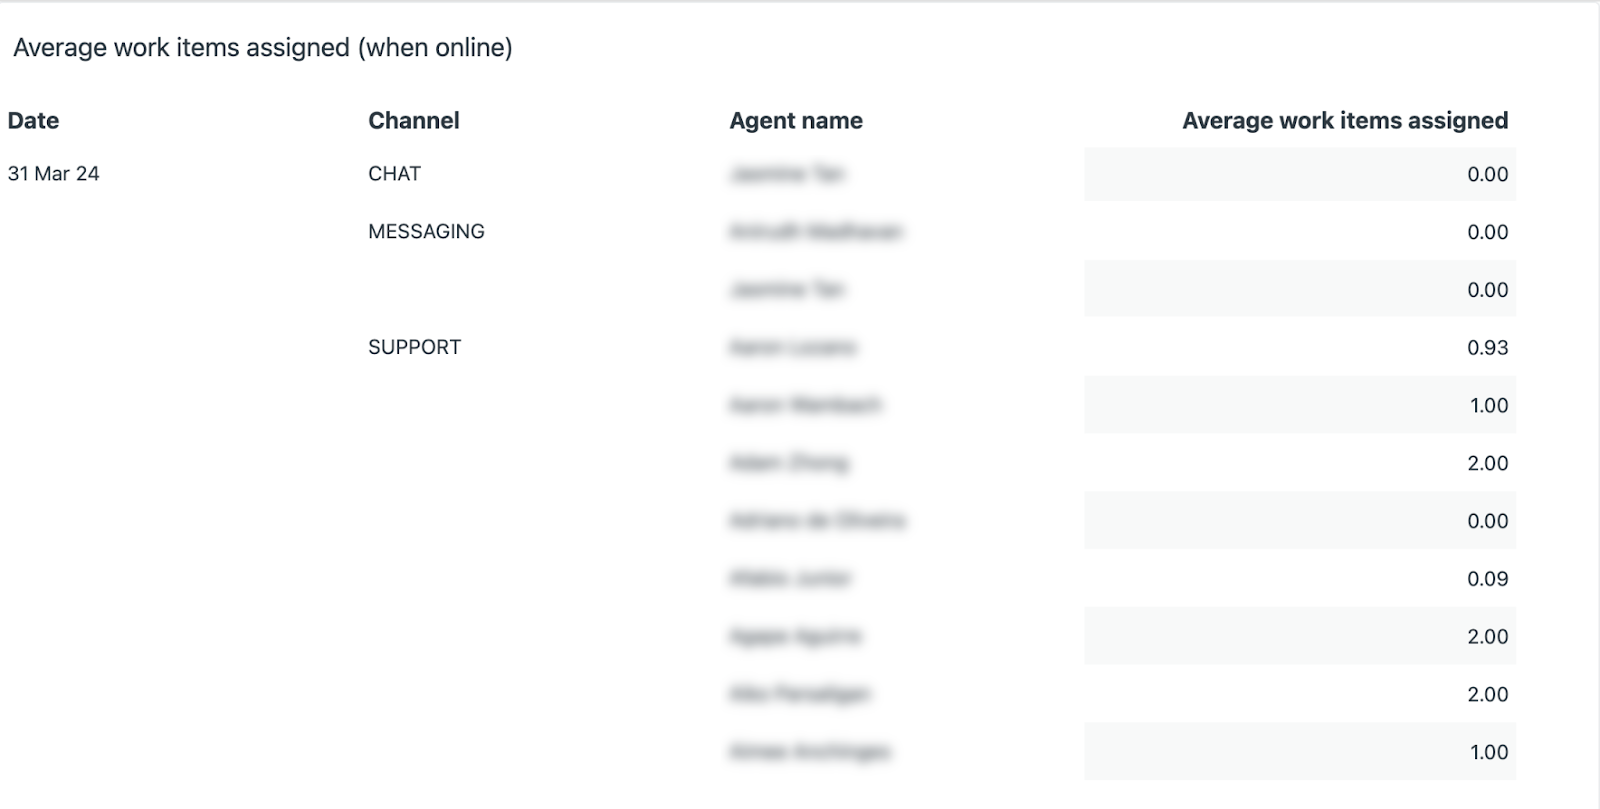
-
Average work items assigned (when online): A table that shows
agents' average used capacity while in an Online state per day.
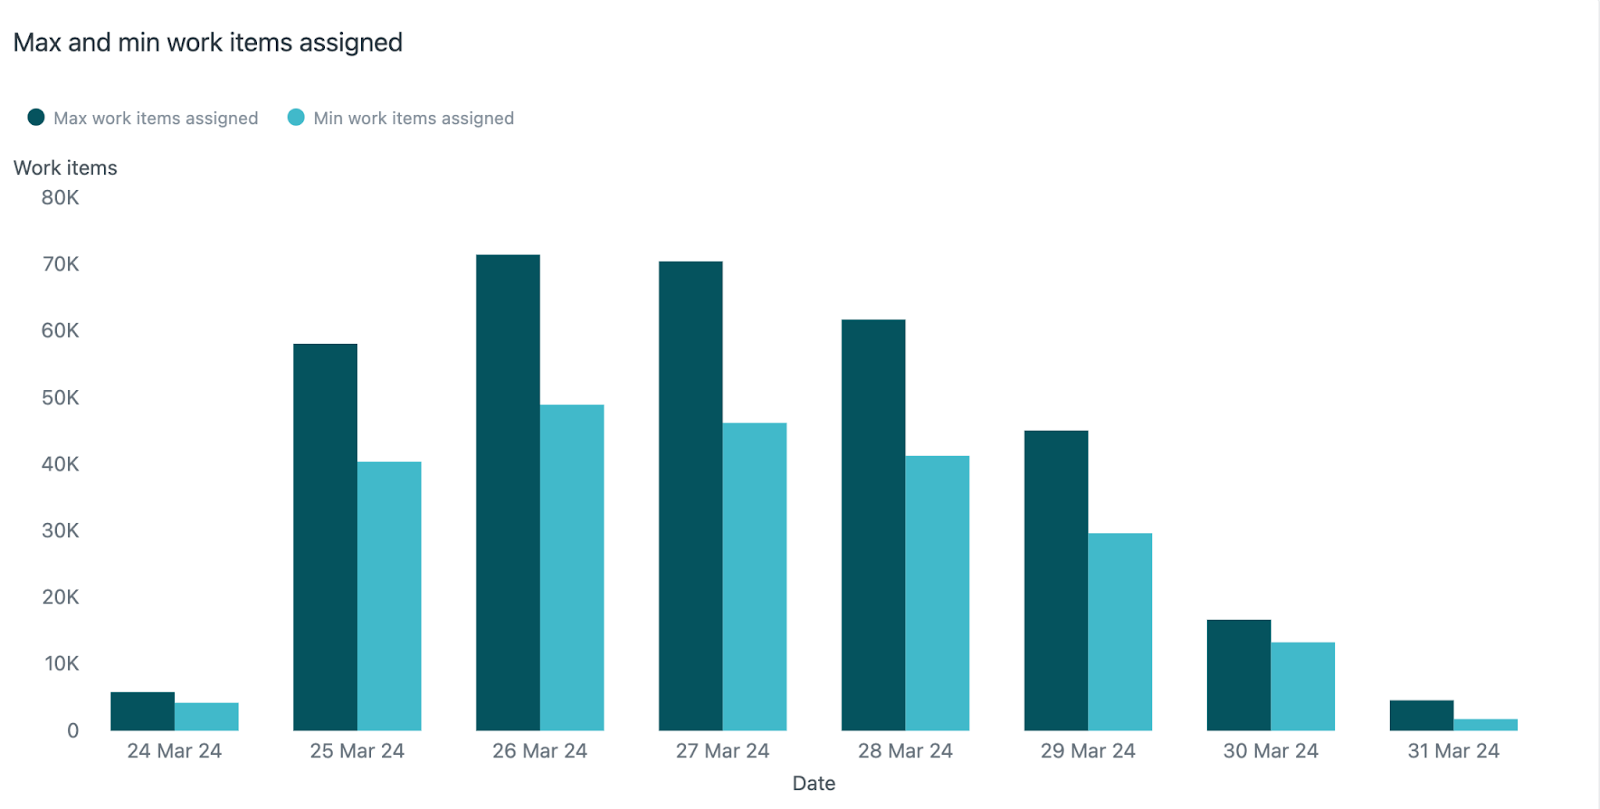
-
Max and min work items assigned: The maximum and minimum
capacity used by agents each day for the past week.
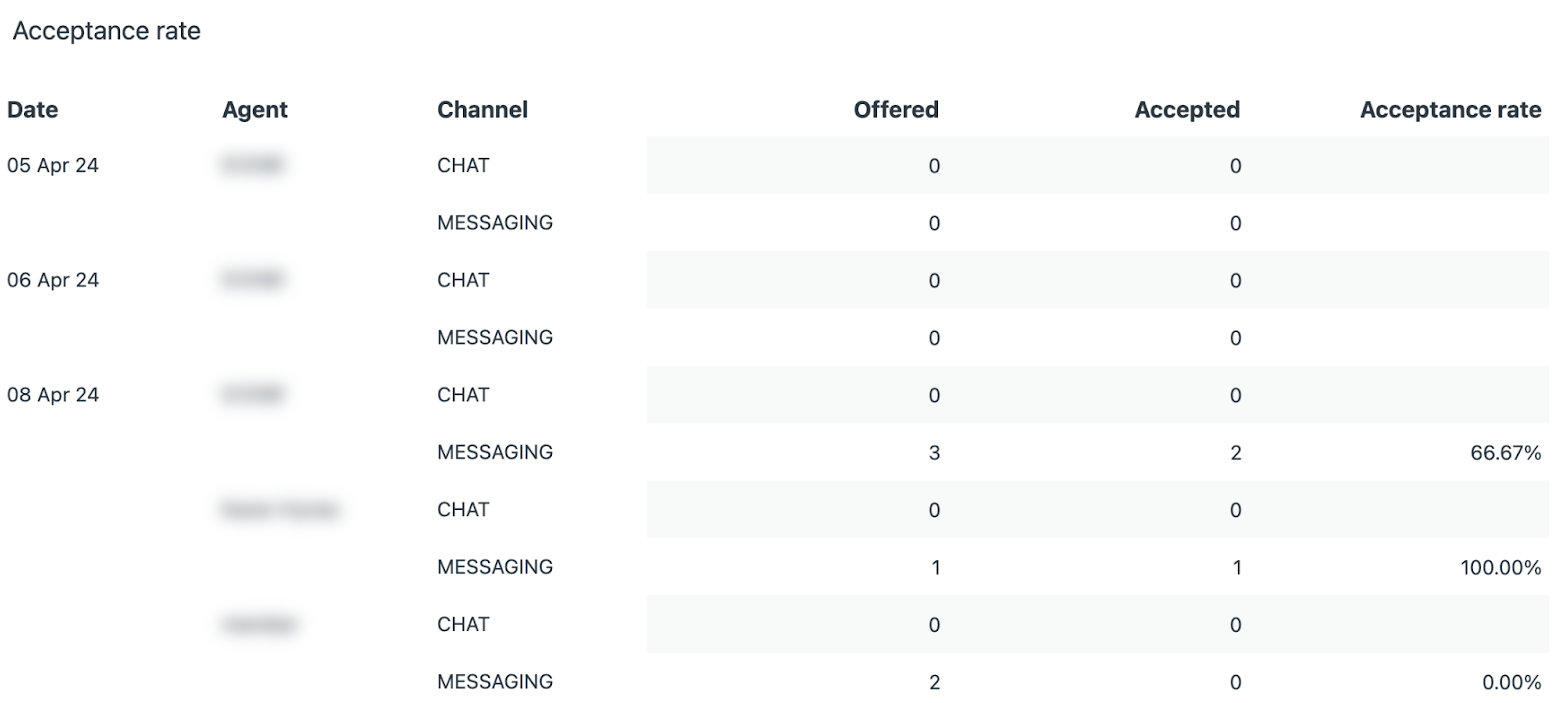
-
Acceptance rate: A table that shows the offer count, accepted count, and
acceptance rate for each agent per day, broken out by channel. Available only
for web and mobile messaging, social messaging, and live chat. Acceptance rate
is not available if auto-accept or broadcast mode is used for routing, or if no
work items were offered to or accepted by the agent.
0 comments
Please sign in to leave a comment.