
The new Explore dashboard doesn't support adding images (though this is planned for a future release). However, with a bit of work, you can add images and animated GIFS to your dashboard. Adding graphics can help you brand your dashboards or add instructional material using animated GIFS.
Here's an example:
In this recipe, you'll learn how to add images and animated GIFS to an Explore dashboard.
This recipe contains the following topics:
- What you'll need
- Getting the images ready
- Creating the report attributes
- Building the report
- Building the dashboard
- Next steps
What you'll need
Skill level: Intermediate
Time required: 20 minutes
- Zendesk Explore Professional or Enterprise.
- Editor or Admin permissions (see Giving agents access to Explore).
- One or more images or animated GIFS hosted on the web in an accessible location.
Getting the images ready
You'll create each image as a separate report and then add them to your dashboard. Use the following steps to get your images ready to add.
To prepare your images
- Resize your image to ensure it doesn't take up too much space on the dashboard. You can't resize the image from the dashboard, so it might take some trial and error to get it to the size that looks best.
- Upload your image to an online location accessible to any of your dashboard viewers. For example, you could use Postimages or imgBB to host your images.
- Create a new dashboard. Alternatively, you can use an existing dashboard to add images.
Creating the report attributes
You need to create a report for each image you want to add. In this example, you'll create the reports using the Support - Tickets dataset, but you can use any dataset you want.
To create the reports
- In Explore, click the reports (
 ) icon.
 - In the Reports library, click New report.
- On the Select a dataset page, click Support > Support - Tickets, then click Start report.
Report builder opens.
- In your report, open the Calculations menu (
 ), then click Standard calculated attribute.
 - On the Standard calculated attribute page, under Name, enter a name for the attribute, such as Dashboard image. You can change this name later if you want.
-
In the Formula field, enter or paste one of the following formulas, including the quotes:
If you want to insert a static image
"<IMG img src=https://<image location>/<image name>>"
If you want to insert an animated GIF"<IMG img src=https://<image location>/<image name>.gif>"
Replace <image location> with the URL of your image and replace <image name> with the image file name.
- Click the report's title and enter a descriptive name, such as "Myimage".
- Click Save.
- Continue creating standard calculated attributes for each image you need.
Building the report
Now that you've created your attributes, you can create reports for each image you want to add to a dashboard.
To build the report
- In the Metrics panel of your report, click Add.
- From the list of metrics, choose a single metric to add to the report, for example, COUNT(Tickets). This is added because all Explore reports must contain at least one metric. Don't worry; you'll learn how to hide it later.
- In the Attributes panel, click Add.
Choose the attribute you created in the previous section from the list of attributes. -
Click the Chart configuration menu (
 ) and select Chart. In the chart menu, change the Text interpretation setting to HTML.
 - In the same menu, turn on Display images. You can then adjust the Height and Width of the image.
- Click the Visualization type menu (
 ) and select Table. Your report will resemble the following screenshot:
- You'll notice that the value of your created metric is displayed. To hide this metric, from the Chart configuration menu ( ), click Columns.
- On the Columns page, click the eye icon for column 2 to turn off the column display as shown below:
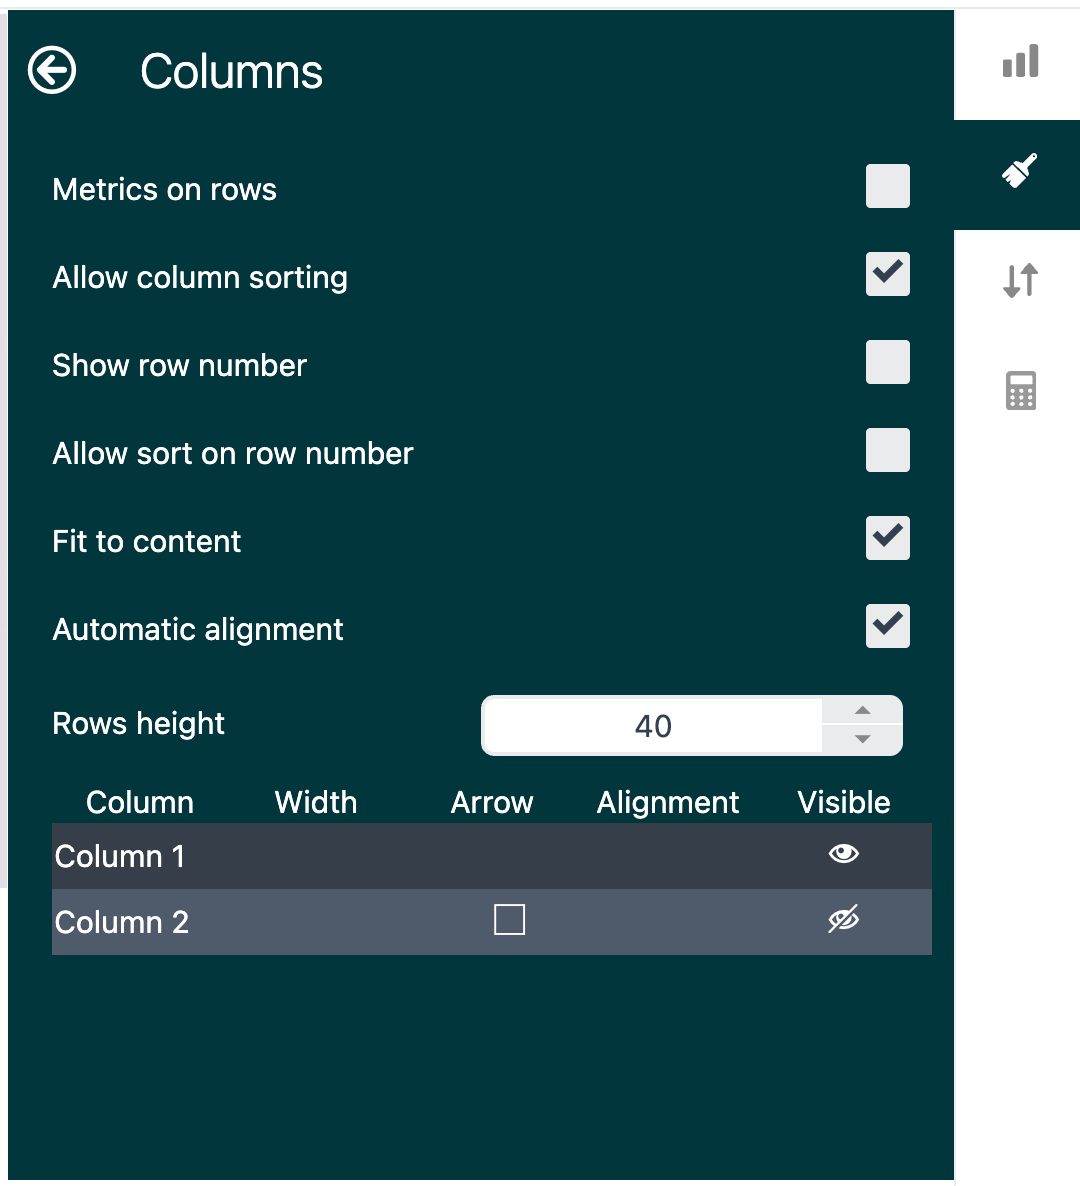
Your report is now displayed without the metric.
Repeat this procedure for any other images or animated GIFS you need.
Building the dashboard
You now have the components you need to build your dashboard. You can add any other Explore components, such as reports and filters, as well as your images and animated GIFS.
To build the dashboard
- In a new or existing Explore dashboard, click the + icon, then select Report.
- Click the image reports you just created from the list of reports. The reports immediately appear in the dashboard.
- Drag, drop, and resize each report to appear as you want.
- Continue adding other reports and filters you need.
- When you're done, publish and share the dashboard.
It's likely that when you first add the images and GIFS to the dashboard, they will not be the size you need. To fix this, edit the report, then, in the Chart configuration menu ( ![]() ), click Chart and adjust the Height and Width until the image is the right size.
), click Chart and adjust the Height and Width until the image is the right size.
Next steps
Feel free to experiment with this recipe. We'd love to see what you come up with! Let us know in the comments below.
0 comments
Please sign in to leave a comment.