In today’s rapidly evolving workplace, using analytics to optimize employee service operations is essential for organizations to effectively support their workforce and enhance productivity.
Zendesk provides powerful analytics tools for employee service, empowering organizations to gain a clearer view of their internal support landscape. With Zendesk, IT and HR teams can track key performance metrics, identify trends in employee inquiries, and assess the effectiveness of their service desk strategies.
In this article, you’ll learn how to use Zendesk to transform help desk data into actionable insights, enhancing service delivery, boosting employee satisfaction, and driving a culture of ongoing improvement.
This article contains the following topics:
Using dashboards to see your information in one place
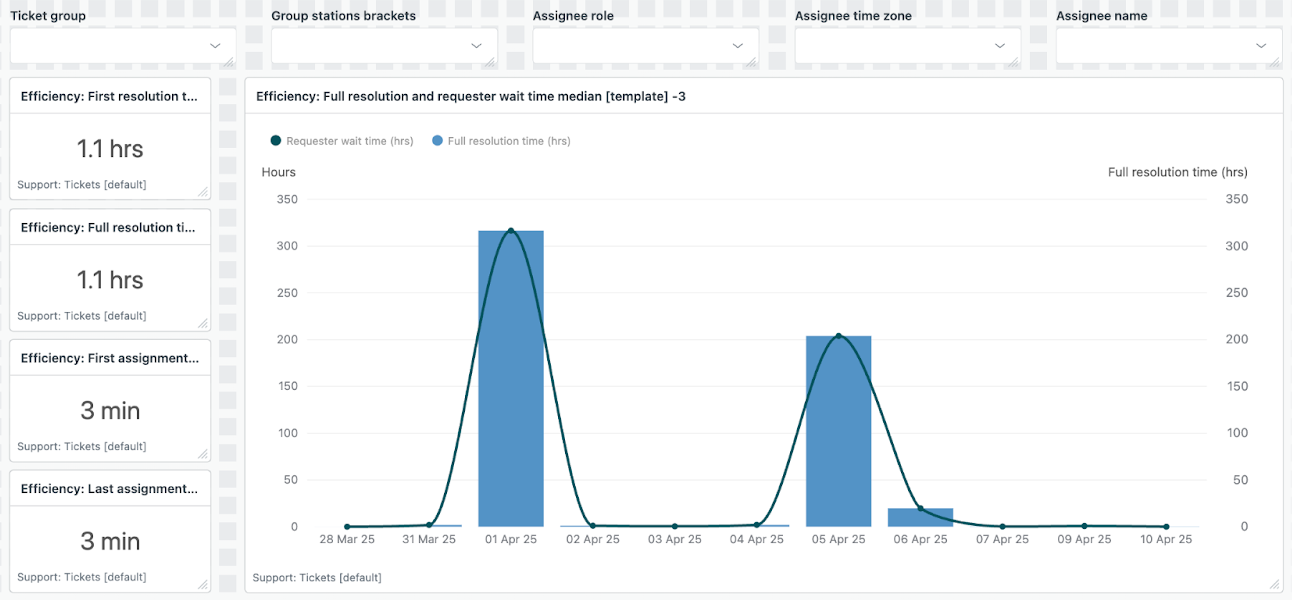
Dashboards are compilations of reports and filters that help you see all your most important employee service metrics in one place. Use the dashboard builder to create, customize, and share service management dashboards.
When you create your dashboard, you can start with a template that contains commonly-used reports and then add further reports as needed. For employee service plans, you start with the Support resolution time template. See the key metrics you’ll want to consider for your HR and IT teams.
Once your dashboard is complete, you can share it, either on a one-time or recurring basis, to help make important data visible to key stakeholders.

To learn more, see Creating Explore dashboards.
Understanding employee service metrics
In the following table, you’ll learn about some of the key metrics you can use to create reports that monitor your employee services. In general, these metrics reflect data for the whole account. However, when adding these metrics to a report, you can filter them by values such as channel, brand, and date.
These metrics are contained in the Support: Tickets dataset.
| Metric | Description | Why it matters | Best practices |
|---|---|---|---|
| Tickets created | Total number of tickets submitted during a specific time period. | Establishes a baseline for normal ticket volume and helps monitor sudden spikes. | Drill in to the total number of tickets to see the individual tickets coming in and look for patterns, especially when you notice an influx. |
| Solved tickets | Total number of tickets solved during a specific time period. | Helps assess whether your team is keeping up with incoming employee demand. | Compare with total tickets created and total resolution time. Drill in to quickly resolved tickets to identify best practices and training opportunities. |
| First response time | Time between ticket creation and the first agent response. | Sets expectations for responsiveness and informs SLA development. Use SLA policies to define standards for response times. | View by ticket group to identify slower response areas. Drill in
for root causes and explore automation opportunities.
Tip: Consider enabling Omnichannel
routing to get tickets to the best-suited agent
faster.
|
| Total resolution time | Time from ticket creation to final resolution. | Indicates the efficiency of end-to-end ticket handling. | Break down by ticket type to identify process gaps. Improve
documentation or provide targeted training where delays
occur.
Tip: Consider using median aggregators instead of averages so outliers don’t skew your
KPIs.
|
| Employee CSAT | Post ticket resolution feedback, usually expressed as the percentage of satisfied users. | Gauges employee satisfaction with the support experience and highlights improvement areas. | View by group to pinpoint friction points. Improve workflows for intents with low CSAT scores. |
Sharing dashboards with key stakeholders
Once your dashboard includes reports containing your key metrics, you can share it with key stakeholders.
There are several ways to share dashboards depending on your goals, including:
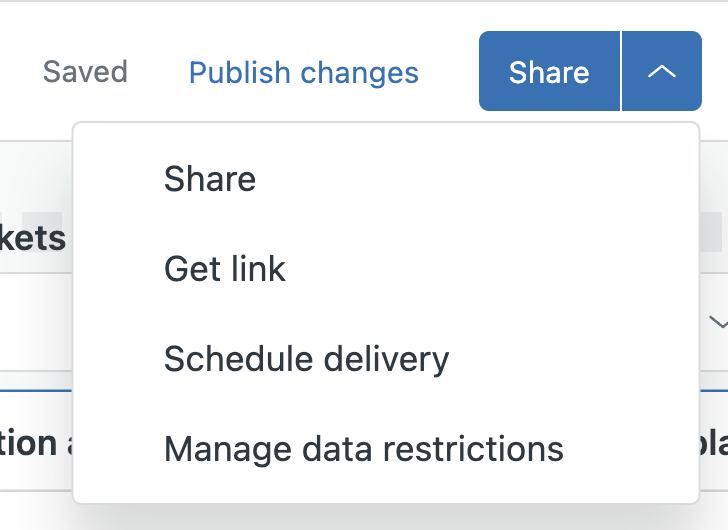
- One-time sharing: You can share dashboards on a one-time basis using a shareable link or by emailing it.
- Scheduled delivery: When you schedule a dashboard delivery, you can set the delivery cadence, format, recipients, and duration.

Different audiences often require different views of your data. You can use dashboard restrictions to tailor the data that each user or group sees.
For example, you can restrict the HR team’s view to only their relevant data by restricting the dashboard to show only brands (or other content) related to the HR team.
This will help ensure that viewers have the right context to take meaningful action.
Additional resources
When you’re ready for more, you might find the following resources helpful:
- Metrics & Attributes for Zendesk Guide: Discover the metrics and attributes you can use to build reports based on your usage of Guide.
- Analyzing your agents’ use of generative AI: Understand how generative AI features are being used by your service team and how their usage affects overall efficiency.
- Analyzing advanced AI agent performance with the Performance summary dashboard: Find out how to view key metrics about your AI agents.
- Explore recipe reference: Get step-by-step instructions on how to create specific reports in Zendesk analytics.

0 comments
Please sign in to leave a comment.